Reflectometer Measurements - Part 2
I have tried to measure three cables and this is the result:
 Interesting notes:

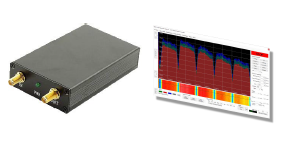
The above pictures shows the benefit of using the AVERAGE mode (cyan), instead of the LIVE mode (green). The random peaks get filtered out and the spectrum gets much more readable.
All in all, I am still fascinated by the results, even if just for educational purposes. It makes learning RF so much more interesting and hands on.
Considering that the required equipment costs less than 100 Euro, there is no excuse for not doing some real experiments.
I am now looking for some theory to explain the non-linear curve, as I imagine that it might be non-linear for other reasons than the ones I listed. If I would better understand how to extrapolate the cable length, I would try to implemente a REFLECTOMETER feature in my software...
Cheers,
vma

- The longer the cable, the smaller the interferences. This requires to set a smaller span in the spectrum analyzer. Unfortunatly at 100m cable length we reach the limit of the SMA Spectrum Analyzer's resultion.
- To overcome this limitation (and because my test cable is exactly 100m long - for obvious reasons), I put my Spectrum Analyzer Software into AVERAGE mode. This will produce a more distinguish spectrum, making the measurement easier.
- I traced the obtained data (frequency span vs cable length) in Excel and unfortunatly, the curve is not linear at all. This may be due to several factors:
- Reduced precision of the SMA Spectrum Analyzer
- Reduced flatness of the low cost SMA noise source
- Unsuitable and unbalanced connectors (see my previous post: in the picture you see the chain of connectors converting between SMA, BNC and F-type - some 50 Ohm, other 75 Ohm...)
- Different cables with different cable propagation speed

The above pictures shows the benefit of using the AVERAGE mode (cyan), instead of the LIVE mode (green). The random peaks get filtered out and the spectrum gets much more readable.
All in all, I am still fascinated by the results, even if just for educational purposes. It makes learning RF so much more interesting and hands on.
Considering that the required equipment costs less than 100 Euro, there is no excuse for not doing some real experiments.
I am now looking for some theory to explain the non-linear curve, as I imagine that it might be non-linear for other reasons than the ones I listed. If I would better understand how to extrapolate the cable length, I would try to implemente a REFLECTOMETER feature in my software...
Cheers,
vma

Comments
Post a Comment